It doesn’t matter whether it’s sports, business, government or healthcare, there is now a sophisticated web of data, technology, and collaboration underpinning all the work done in the organisation.
Success doesn’t come from collecting the most data. Instead, it’s the way the organisation makes sense of that information that matters. Now, more than ever, data-driven insights are core to a business’s success, and they are only as powerful as the systems, dashboards and storytelling that bring them to life.
33% of C-suite, senior managers, and IT managers saw "data-driven insights to support decision-making" as the biggest tech opportunity in 2024 (CERT NZ, 2024).
Strategy at Speed: Why Insights Matter in the Moment
In high-stakes environments, decisions can’t wait. Whether you’re optimising player performance or improving service delivery, modern decision-making depends on having fast, actionable data.
To achieve this goal, leading organisations are now building real-time dashboards that integrate multiple sources of data into a single, intuitive view. These dashboards don’t just visualise past performance; they inform next steps. They highlight patterns, flag anomalies, and focus attention where it’s most needed.
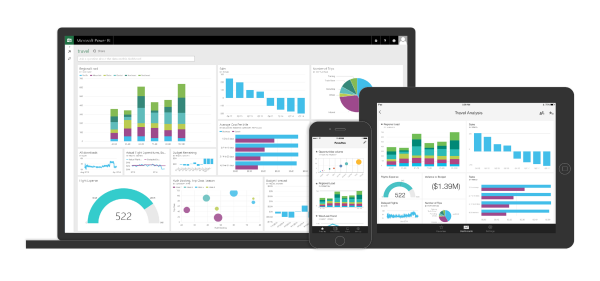
Tools like Microsoft Power BI are playing a vital role here. Dashboards can be designed in the off-season or planning cycle, then automated to refresh as new data becomes available. This can be at any cadence, whether daily, weekly, or in real time. This enables leaders to make decisions quickly and without wasting hours wrangling spreadsheets or digging through reports.
Combining Data Sources, Creating Clear Stories
To make the most of the potential for analytics, it’s important to be able to bring together diverse data sets in a coherent manner. This includes data such as performance metrics, historical benchmarking, targets, budgets and even behavioural data.
As you might expect, this isn’t necessarily easy. The question on how to derive actionable insights from a combination of historic and benchmarking data will always be one that organisations need to grapple with. However, there are some that are achieving demonstratable success, and doing so in some of the most pressure-filled environments imaginable.
Work with the data you need
The challenge for most organisations with a proliferation of cloud services is data sprawl, and the cost and complexity of combining this into a single source of truth.
One way that you can work around this with PowerBI, is by focusing only on the data you need. By taking daily snapshots directly from your CRM, ERP and Financial platforms and layering this with internal metrics and coded insights you can produce meaningful dashboards, eliminating the cost and complexity of building a dedicated data warehouse. In tackling the challenge this way, the most effective visualisations are built in advance, and they can be deployed instantly after events, audits, or planning sessions.
This kind of integrated, visual storytelling is where the true strategic value of data comes to life. A graph or dashboard may appear simple, but under the surface is a carefully engineered pipeline of cloud-based tools, secure file sharing, and smart automation.
The AI Layer: What’s Coming Next
As data volumes grow, many organisations are turning to AI and machine learning to help make sense of it all. By using statistical modelling and predictive analytics, leaders can go beyond “what happened” to explore “what’s next.”
This includes regression models to understand which metrics most closely correlate with success, algorithms that highlight underperformance before it shows up in results, and tracking technologies that enable detailed behavioural analysis.
Collaboration Is the Competitive Edge
Ultimately, data is only useful if it’s understood. The most impactful dashboards and analytics environments aren’t the flashiest, but rather are the ones built for the user.
That means understanding how different stakeholders prefer to consume information. Some respond to graphs.
Others want video, charts, or simply something that represents a traditional spreadsheet one-page briefs. Whether it’s a frontline team leader or a C-suite executive, personalising insights to achieve actionable outcomes is what unlocks true value.
That’s also where collaboration plays its greatest role. When analysts, leaders, and frontline teams work together to define how to best measure success, data becomes a shared language, not a specialised silo.
Want to hear how these principles play out in one of New Zealand’s most high-pressure environments? Listen to the latest episode of the Lifting the Lid podcast, where Head of Performance Analysis at The Blues, Adam Foy, breaks down how dashboards, video, and data security shape decision-making on and off the field.